Data and study sample
The study participants were selected from the CFPS, a large-scale, nationwide and continuous social tracking survey project conducted every two years by the China Social Science Survey Center of Peking University. The survey uses a stratified sampling method with unequal probabilities at five levels, namely, provinces and cities, districts and counties, streets and towns, villages and households. It encompasses 25 provinces, municipalities and autonomous regions. Additionally, the survey includes questionnaires on internet usage, chronic diseases and healthcare expenditures, providing a robust data source for our investigation.
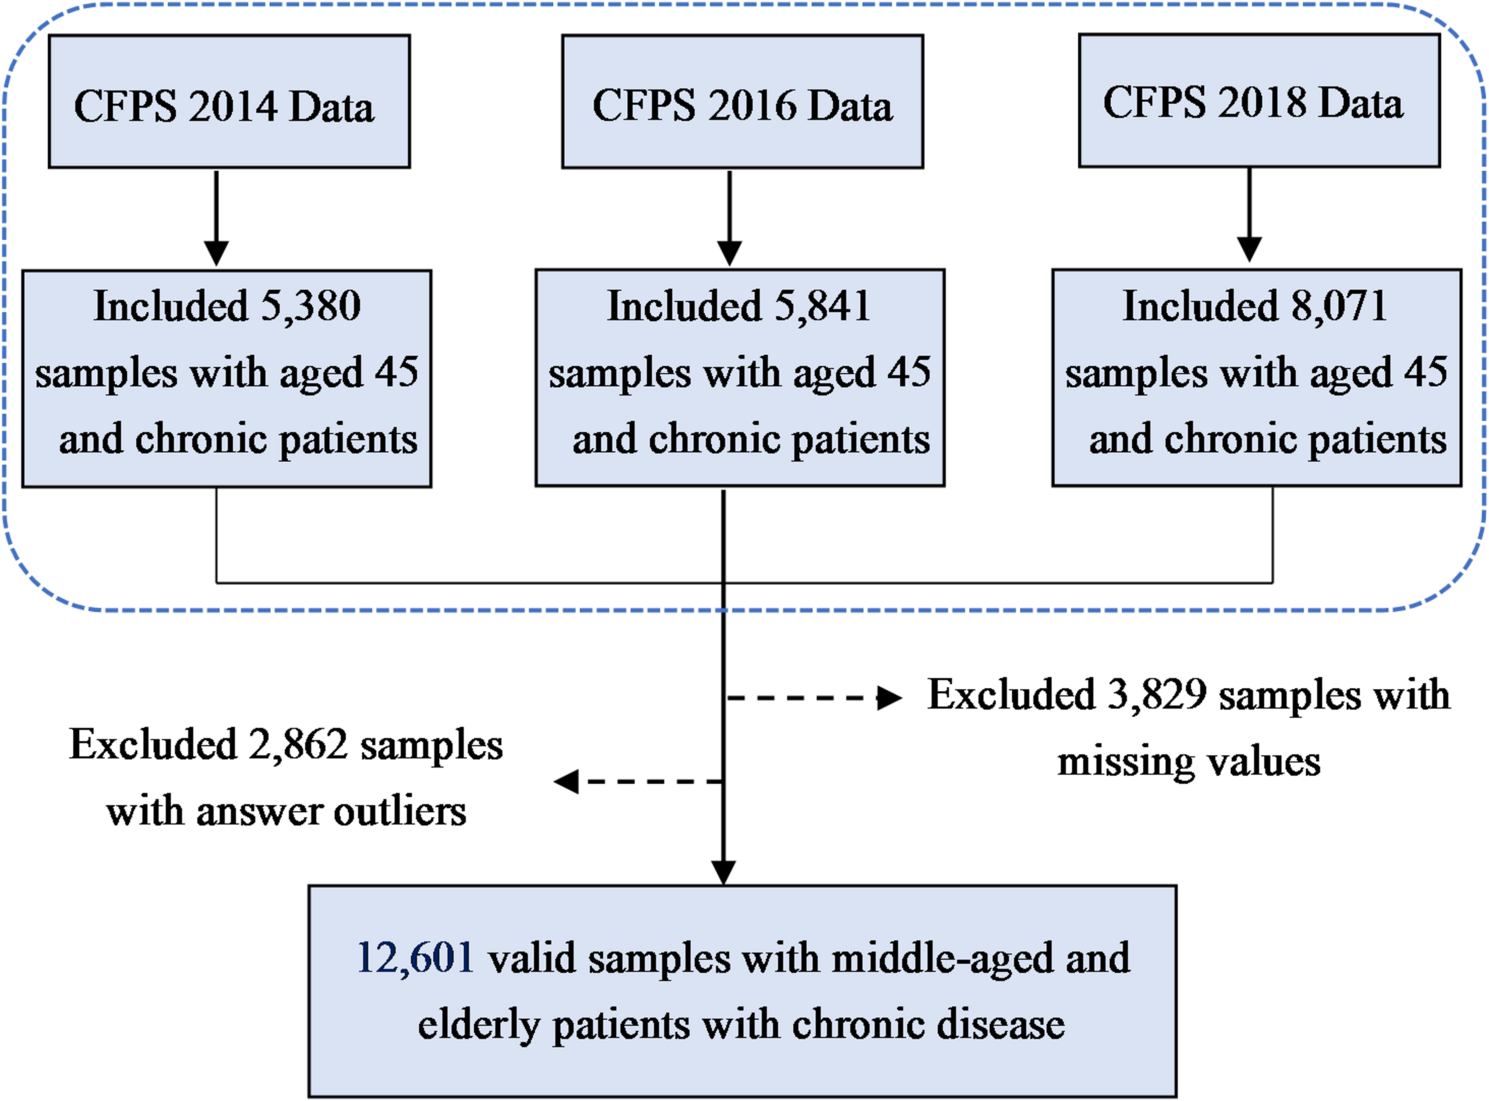
Considering the timeliness of the study content and the reliability of the findings [38], we expanded the sample size by using CFPS data from 2014, 2016 and 2018 to form a panel database. The questionnaire was designed based on baseline data, so the survey questions were repeated across each wave for individuals surveyed in 2014, 2016 and 2018. The CFPS database consists of a family database, adult database and child database. We used the adult database for analysis because the study focuses on middle-aged and older adults with chronic diseases. We selected those aged over 45 with chronic diseases. After removing samples with missing data and outliers, we finally constructed a panel database containing 12,601 samples to examine the relationship between internet usage and healthcare expenditure in these populations (Fig. 1).
Flow chart of sample selection
Measures
Outcome variables
Our study centred on healthcare expenditure among middle-aged and elderly adults with chronic diseases as the outcome variable. A question from the CFPS asked participants to indicate their healthcare expenditure, including medicine, medical treatment, hospitalization and other expenses, over the past year. The report included reimbursed and to-be-reimbursed amounts. The distribution of the outcome variable was evaluated using a standardised normal distribution probability plot (Fig. 2).
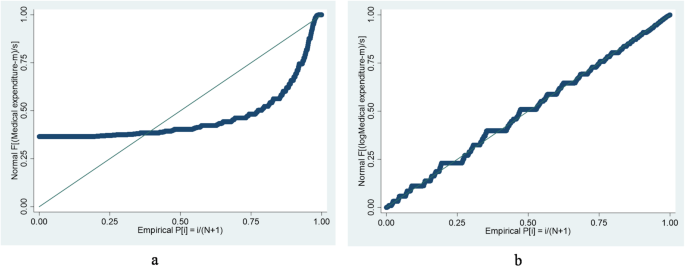
Standardized normal distribution probability plot of healthcare expenditure
Notes: plot a indicates normal distribution of healthcare expenditure before logarithmic transformation; plot b indicates normal distribution of healthcare expenditure after logarithmic transformation
Explanatory variables
Internet usage was the primary explanatory variable. It was measured using two CFPS questions: ‘Do you have mobile internet access?’ and ‘Do you use computer to access the internet?’. Responses were coded as 0 if both answers were ‘no’ and 1 if either or both answers were ‘yes’.
Instrumental variables
Internet usage was self-reported, which might lead to estimation bias because of potential endogeneity problems. Therefore, we used the instrumental variable (IV) method to solve endogeneity problems. Drawing on the relevant literature [39, 40], we selected the average internet usage of other respondents in the community and the internet penetration rate at the district and county levels as instrumental variables. Theoretically, these two instrumental variables are consistent in correlation and exogeneity. Firstly, because individuals living in the same community or village are likely to experience behavioural interaction effects [41], and network infrastructure development is region-specific, the establishment of such infrastructure in a region facilitates easy internet access within the community. As a result, the expected behavioural interaction effects tend to create a correlation between an individual’s internet usage and the community average. Furthermore, internet penetration at the district and county levels directly affects individual internet usage within the region. Secondly, the internet usage of other respondents in the same community and the internet penetration rates at the district and county levels serve as objective indicators that are not directly related to individual healthcare expenditure or self-rated health status.
Mediating variable
The mediating variable in this study was self-rated health, and it was assessed using the question: ‘How do you feel about your own health now?’. Participants were asked to select their responses form five options: unhealthy, fair, relatively healthy, basically healthy and very healthy. To enhance the accuracy of measurement, the five categories were retained and assigned scores from 1 to 5 [42], with a higher score reflecting a better self-rated health.
Control variables
Control variables were based on relevant literature and included demographic and socioeconomic characteristics. Firstly, demographic characteristics included gender (0 = female,1 = male), marital status (0 = without spouse,1 = with spouse), years of education, nature of household registration (0 = non-agricultural,1 = agricultural), religion (0 = none,1 = yes) and severity of the disease (ordered categorical variable). Secondly, socioeconomic characteristics included participation in medical insurance (0 = not participating,1 = participating), employment status (0 = not working, 1 = working), personal income, level of access to medical institutions (ordered categorical variable) and region of residence (1 = eastern, 2 = central, 3 = western).
Statistical analysis
All data analyses were conducted using Stata 15.1 software. Descriptive statistics were employed to summarise all the variables in the dataset. For the empirical analysis, this study utilised unbalanced panel data from the period 2014–2018. As healthcare expenditure was the continuous outcome variable and the explanatory variables remained consistent over time, we employed the fixed effects model (FEM) to examine the association between internet usage and the healthcare expenditure of middle-aged and older individuals with chronic diseases. The FEM is well suited to analysing longitudinal data with a continuous outcome variable because it can effectively control for the effects of time trends and individual characteristics that remain constant over time [43].
To assess the robustness of the baseline regression results, we conducted robustness tests from four aspects: the IV method, subsample regression, supplementary variable method and propensity score matching (PSM). Given the endogeneity issue with individual internet usage, we selected the community-level average internet usage and district- and county-level internet penetration rates as instrumental variables, estimating them using the two-stage OLS model. Additionally, because the decision to use the internet is not random but based on an individual’s self-assessment, the problem of self-selection could potentially introduce selection bias in the relationship between internet usage and healthcare expenditure. Therefore, we employed PSM to estimate the average treatment effect (ATT) of internet usage on healthcare expenditure. Furthermore, we used the Karlson–Holm–Breen (KHB) method to analyse the mediation effect of self-rated health and assess the indirect effect and the proportion mediated by self-rated health. Considering the potential causal relationship between internet usage and self-rated health, which could affect the results of the mediation analysis, we also used an IV-based mediation method to further test the robustness of the mediation effect results. This method allows for the introduction of instrumental variables to address endogeneity between internet usage and self-rated health [44].